


Jen Shearman, MEI’s Chief Learning Officer, explores the opportunities and challenges highlighted by PISA 2025 and considers how we can pivot towards greater success and equity for all learners.
The release of the latest international maths assessment results, PISA 2025, in September 2026 has been widely reported as a ‘good news’ story for UK maths education. The UK has risen in the PISA rankings from 12th to 11th , jumping ahead of Canada, and is now the third-highest performing country outside of Asia.
The results provide genuine reasons for optimism. More young people are demonstrating the mathematical literacy needed for future study and work, and the UK continues to perform strongly internationally. However, headline rankings tell only part of the story. Beneath the encouraging national picture, the data show disparities between nations of the UK and persistent inequalities between boys and girls, and between advantaged and disadvantaged students.
In reflecting on the UK’s success, Dr. Nicola Trubridge writes in her blog for the NCETM that secondary mathematics is at a ‘pivotal moment’. I’ll follow on from her blog by considering the evidence within the PISA results to suggest what these pivotal moments might be, and identify opportunities for the maths education community, including organisations like MEI and government-funded programmes including the Advanced Mathematics Support Programme (AMSP) and the National Centre for Excellence in the Teaching of Mathematics (NCETM), to help maths education move further in the right direction.
At MEI, we are particularly interested in what the results reveal about mathematical literacy, participation and equity, because these are central to our mission of improving maths education for all learners.
1: Pivot our mathematically-literate students towards continuing their mathematical studies.
The evidence from PISA is that ¾ of our 15-year-olds are on track to become mathematically literate (Figure 1). 74% of students attained at least Level 2 proficiency in mathematics, demonstrating:
“an ability to represent a simple situation mathematically, such as comparing the total distance across two alternative routes, or converting prices into a different currency.”
13% of UK students attained the top levels 5 and 6, so can:
“model complex situations mathematically and select, compare and evaluate appropriate problem-solving strategies for dealing with them.”
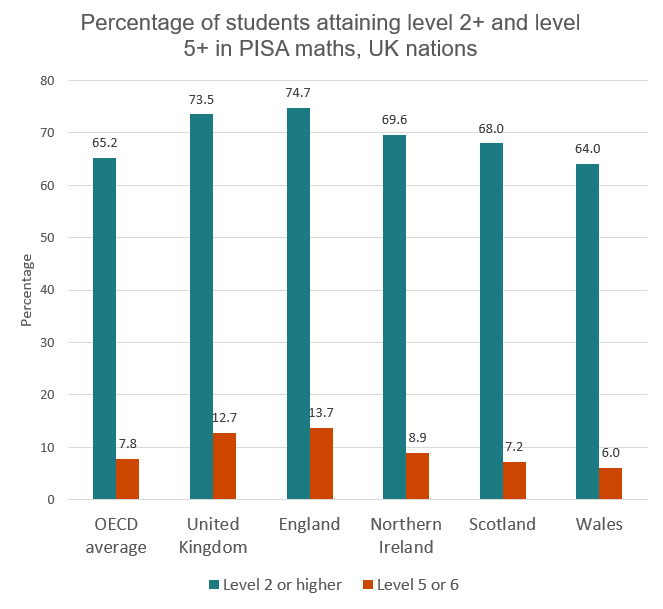
Figure 1: % of students attaining L2+ and L5+. Source: OECD
These 15-year-old students, who are currently benefiting from a mathematics education providing them with deep understanding of mathematical concepts and being prepared for their future studies and work, should be enabled and encouraged to continue their development post 16.
The UK post 16 offer for mathematics is high-quality and wide-ranging, with Level 3 Core Maths qualifications being designed specifically to develop students’ skills in using mathematical representations to solve problems in multiple contexts. Core maths could (and arguably should) be studied by all students with a good GCSE pass in maths who choose not to pursue maths at A-level, yet currently only 37% of all post 16 A-level students study a distinct mathematical qualification (Norris and Noyes, 2026).
More than ever, young people will need a high level of mathematical literacy to navigate their future work and lives successfully, so organisations such as MEI need to help all schools and colleges give students an opportunity and encouragement to study Core Maths, and also ensure that new and developing level 3 pathways such as V and T levels have high quality mathematical literacy elements.
Jen Shearman – MEI’s Chief Learning Officer
2: Pivot attention towards communities and students not achieving as highly as others.
The evidence from PISA adds even more weight to the body of knowledge showing that all students do not yet have an equal chance of gaining a deep understanding of maths.
UK results highlight large regional inequalities. The UK’s four nations are not performing equally well: the mean mathematics score for students in England (492) was significantly higher than the scores in Northern Ireland (473), Scotland (467) and Wales (456), with these three nations experiencing a downturn from previous years (Figure 2). Although England has the highest mean score, and a greatest proportion of students working at the highest levels of attainment (Figure 1), England also has the largest range of attainment, with a 268-point difference between the highest and lowest performing percentiles, compared to an OECD average difference of 244. This suggests that the results in England hide a bigger story of regional inequalities beneath the positive mean average figure.
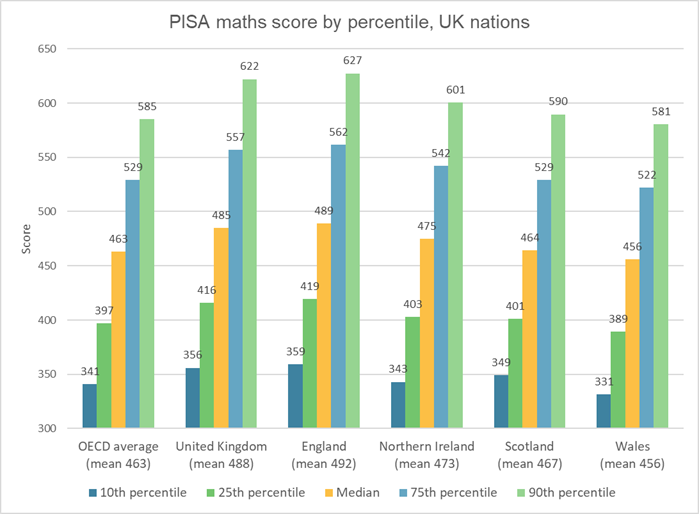
Figure 2: PISA maths scores, UK nations. Source: OECD
Girls and boys are not performing equally well (Figure 3). Just like the TIMSS results two years ago, boys in the UK attained higher scores on average than girls, and this gender gap is rising. The OECD average gender gap is 14 points, and the UK average is 24. England has the biggest gender gap, of 26 points.
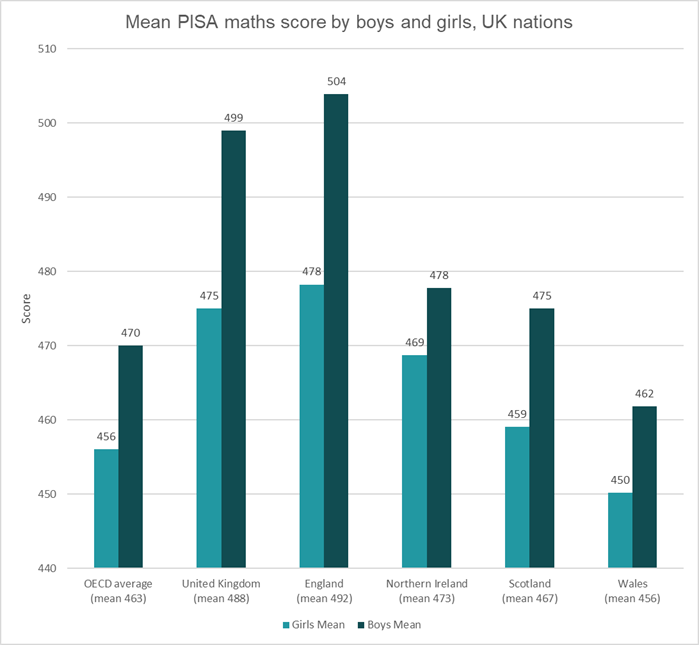
Figure 3: PISA maths scores by gender, UK nations. Source: OECD
Students from disadvantaged backgrounds scored lower. In England, pupils who were eligible for Free Schools Meals (FSM) in 2025 achieved an average mathematics score of 448, significantly below the score for pupils who were not eligible for FSM (497) (DfE, 2026). Using the OECD’s own measure for socio-economic disadvantage, the Index of Economic, Social and Cultural Status (ESCS), we note an 87-point difference between the maths scores of the least and most disadvantaged groups, higher than the OECD average of 83. England’s disadvantage gap, 89 points, was the highest of all four home nations (Figure 4).
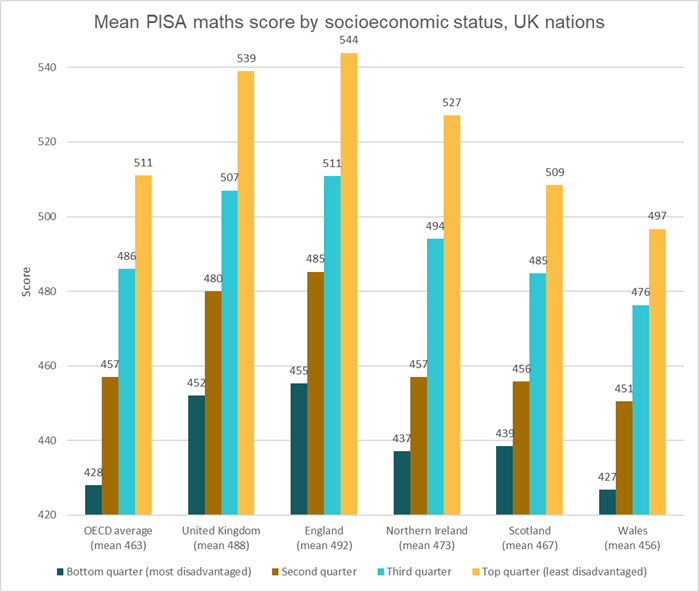
Figure 4: Disadvantage gap in maths PISA scores, UK nations. Source: OECD
The OECD presented some other interesting measures for the disadvantage gap. One is looking at ‘marginal gains’: the increase in PISA score that was associated with a one-unit increase in ESCS. This was 10.1 for the UK compared to an OECD average of 12, which suggests that the negative effects of disadvantage are perhaps less in the UK than other OECD countries. Another interesting measure was the percentage of ‘mathematically resilient students’: the students judged to be disadvantaged and who scored in the top quarter of performance. The UK was calculated to have 13% ‘mathematically resilient’ students, compared to an OECD average of 11.8% (Figure 5).
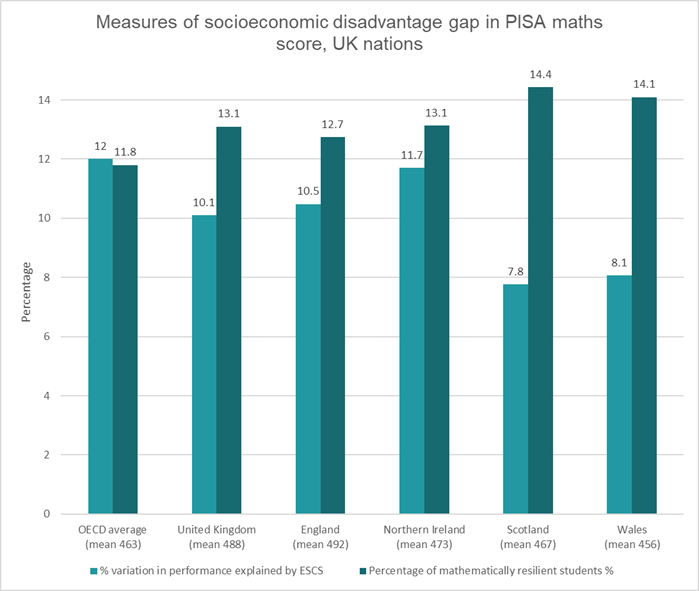
Figure 5: Measures of disadvantage gap, UK nations. Source: OECD.
Pivot towards success for all
Like all large datasets, we must be wary of errors and biases: Northern Ireland, Scotland and Wales are much smaller than England (PISA data for regions in England are not available) and PISA’s sampling methods are open to challenge. However, few maths education professionals will be surprised by either the overall good news story, or the underlying inequalities highlighted by the PISA maths results.
There is a growing weight of evidence that English national maths initiatives, spearheaded by the Maths Hubs, NCETM and AMSP, provide a platform for maths achievement in schools and colleges. There is also growing evidence that the progress of groups currently on a path to mathematical success – higher prior attaining boys from affluent families and communities with fewer challenges – is accelerating faster than under-represented and under-resourced student groups. For all students, there is work to be done to make sure that they can access enticing and appropriate pathways to continue studying maths post 16.
Inequalities are not caused by one thing, and unpicking the nature and consequences of disadvantage is complex, maths education alone cannot solve every challenge. We should however think deeply about how organisations such as MEI can work most effectively with the communities, schools and colleges to best benefit students who are struggling most with maths. We should consider how maths classroom environments and pedagogies could be refined to allow girls to thrive as much as boys. We should seek to understand the reasons why take up of non-A level post 16 mathematics is not as high as it could and should be. We do not yet have the answers, so listening, researching and collaborating with other expert groups is important.
And what might successful pivots mean?
The average PISA maths score for a UK boy in the least disadvantaged ESCS decile was 550. If that score had been the overall UK average then the UK would have been third in the worldwide rankings, above Macao, Chinese Taipei and Japan. Achieving greater equity in maths education means that international attainment in mathematics comparable to the most successful countries would be within the UK’s grasp.
The PISA results suggest that the UK’s challenge is not simply raising attainment. It is ensuring that every young person, regardless of background, gender or postcode, has the opportunity to achieve mathematical success.
References
Department for Education [DfE] (2026), PISA 2025 – National report for England https://www.gov.uk/government/publications/pisa-2025-national-report-for-england
Norris, J. and Noyes, A. (2026), Mathematics provision and non-participation at advanced level in England: who is not studying post-16 mathematics?, Teaching Mathematics and its Applications: An International Journal of the IMA, Volume 45, Issue 2, June 2026, Pages 181–206, https://doi.org/10.1093/teamat/hraf009
OECD (2026), PISA 2025 Results (Volume I): Future-Ready Students, PISA, OECD Publishing, Paris, https://doi.org/10.1787/73451bc5-en
Trubridge, N, (2006), ‘What PISA 2025 tells us as we plan for the new secondary maths curriculum’, NCETM. https://www.ncetm.org.uk/features/what-pisa-2025-tells-us-as-we-plan-for-the-new-secondary-maths-curriculum/