The Critical Maths project aimed to build on the ideas of Professor Sir Timothy Gowers to develop a suitable mathematics-based curriculum for post-16 students who had succeeded at GCSE but were not intending to take A level Mathematics.
Background
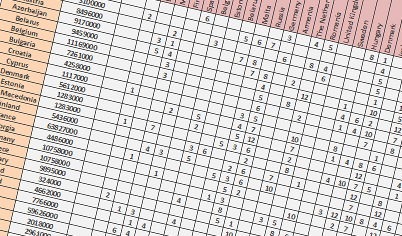
Research published by the Nuffield Foundation in 2010 showed that levels of participation in maths education post-16 in England were significantly lower than in other developed countries, and reports from the Advisory Committee for Mathematics Education in 2011 highlighted the need for more young people to learn maths to a higher level in order to meet the needs of industry and higher education.
To increase the level of participation, a new curriculum was needed, suitable for students who have achieved a standard pass in GCSE Mathematics.
Funding
The DfE funded MEI to investigate how Professor Sir Timothy Gowers’s ideas might inform a curriculum that could become the basis of a new course for students who do not currently study maths post-16.
Activities
Our work included the following aspects:
- Consulting with higher education, employer organisations, learned societies and professional bodies across a range of disciplines and an advisory group of experts to develop a suitable curriculum. The curriculum was based on students engaging with realistic problems and developing skills of analysing problems and thinking flexibly to solve them. Careful consideration was given to the kinds of problems which would be appropriate for the students to work on, with a particular emphasis on the kinds of situations which might come up in a conversation with friends.
- Developing teaching and learning resources which were trialled in schools and colleges. The purpose of this trialling was to refine the resources to ensure that they worked as intended and were engaging to the target audience.
- Developing and trialling a suitable assessment methodology to enable the curriculum to be assessed in a way that encourages the development of transferable mathematical and statistical problem-solving skills. Such problem-solving skills are highly valued by higher education and employers.
- Developing a professional development programme to introduce teachers to teaching starting from a context and steering discussions to maximise learning. These approaches were also being used in Japan and in the Netherlands. Professor Gowers stressed the importance of this in his blog.
Access to the classroom-trialled resources produced through this work is available through a guest-login to Integral resources:
“The main point is one I’ve basically made already: the discussions should start from the real-life problem rather than starting from the mathematics. Pupils should not feel that the question is an excuse to force some mathematics on them: they should be interested in the question and should feel the need for the mathematics, the need arising because one can give much better answers if one models the situation mathematically and analyses the model.”
Professor Sir Timothy Gowers, Gowers’s Weblog
Impact
This curriculum development work, together with the Integrating Mathematical Problem Solving project findings was made available to inform awarding bodies’ development of the new Core Maths qualifications, designed for students who have passed GCSE Mathematics but who do not intend to pursue a strongly maths-related discipline in higher education or employment. Core Maths qualifications were taken by over 12,000 students in 2021. The potential cohort is over 250,000 and the long-term aim is that over 100,000 students will take Core Maths qualifications each year.