
MEI has produced this summary of all entries and results for Core Maths qualifications since 2016, when the examinations were first taken.
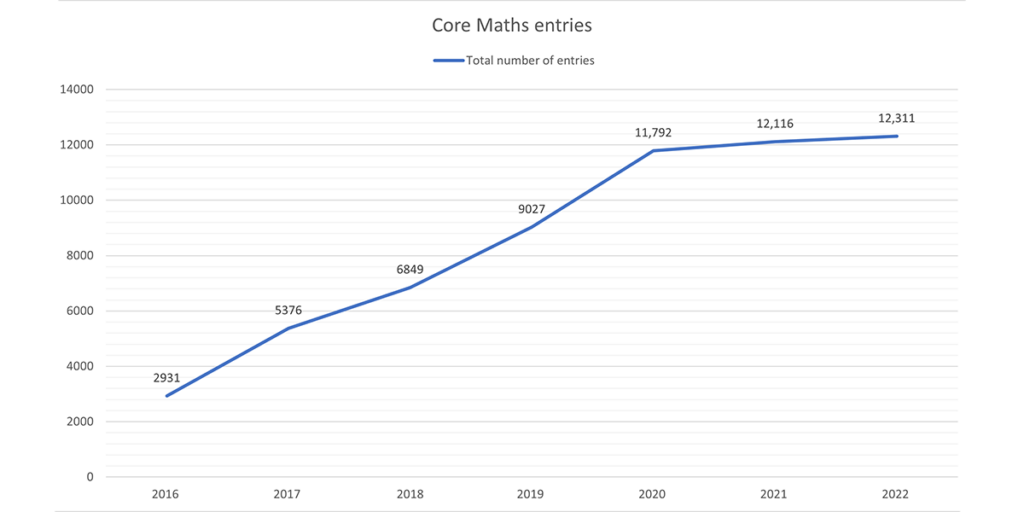
As illustrated in the table below, the total number of Core Maths entries has increased each year, rising from 2931 in 2016 to 12,311 in the most recent entry figures from 2022.
| Year | Total number of entries |
|---|---|
| 2016 | 2931 |
| 2017 | 5376 |
| 2018 | 6849 |
| 2019 | 9027 |
| 2020 | 11,792 |
| 2021 | 12,116 |
| 2022 | 12,311 |
The chart below shows the yearly rise in Core Maths entries from 2016-2022.
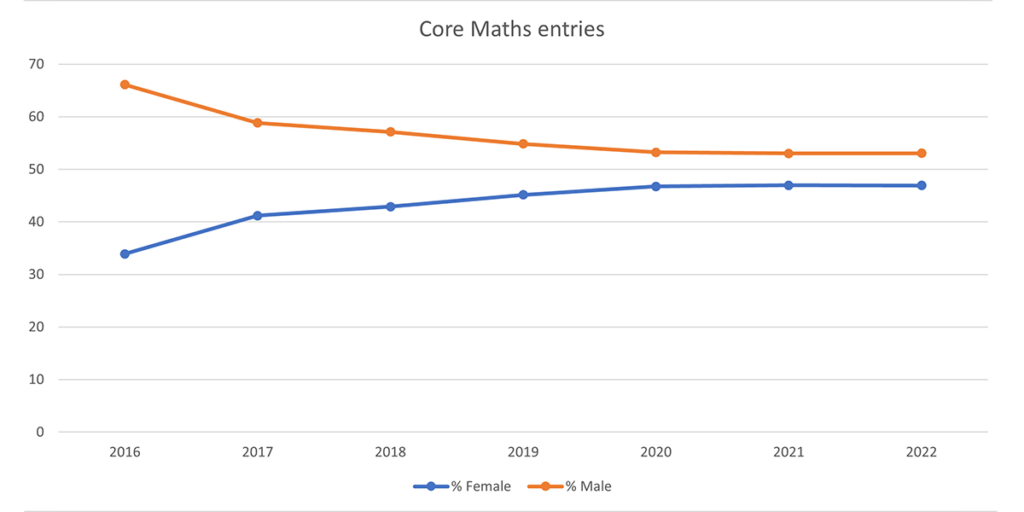
The table and graph below both illustrate the rise in the proportion of girls taking Core Maths from 2016 to 2022, increasing from 33.90% in 2016 to 46.93% in 2022.
| Year | % Female | % Male |
|---|---|---|
| 2016 | 33.90 | 66.10 |
| 2017 | 41.17 | 58.83 |
| 2018 | 42.89 | 57.11 |
| 2019 | 45.16 | 54.84 |
| 2020 | 46.76 | 53.24 |
| 2021 | 46.97 | 53.03 |
| 2022 | 46.93 | 53.07 |
Results statistics
Notes
- These results have been compiled from exam board results, as published on results day in August, and do not take account of any future amendments to results due to appeals etc.
- The numbers have been calculated from rounded percentages published by the exam boards; these have then been used to calculate percentages at each grade. There are likely to be some rounding errors so the final digit in each number may not be accurate.
June 2022
Total entries: 12,311
| GRADE | A | B | C | D | E | U | TOTAL |
|---|---|---|---|---|---|---|---|
| Number attaining this grade | 3388 | 2652 | 2314 | 1716 | 1190 | 1052 | 12,312 |
| Percentage attaining this grade | 27.52 | 21.54 | 18.79 | 13.94 | 9.67 | 8.54 | 100 |
| Cumulative percentage | 27.52 | 49.06 | 67.85 | 81.79 | 91.46 | 100.00 |
Notes
- The total of 12,312 in the table shows that there is a rounding error in at least one of the figures.
- June 2022 results were the first post-Covid exam results and grade boundaries were set so that standards were between 2021 and 2019.
June 2021
Total entries: 12,116
| GRADE | A | B | C | D | E | U | TOTAL |
|---|---|---|---|---|---|---|---|
| Number attaining this grade | 3912 | 2911 | 2360 | 1514 | 990 | 429 | 12,116 |
| Percentage attaining this grade | 32.29 | 24.03 | 19.48 | 12.50 | 8.17 | 3.54 | 100 |
| Cumulative percentage | 32.29 | 56.31 | 75.79 | 88.29 | 96.46 | 100.00 |
Notes
- June 2021 grades were awarded without examinations taking place, due to the Covid‑19 lockdown
June 2020
Total entries: 11,792
| GRADE | A | B | C | D | E | U | TOTAL |
|---|---|---|---|---|---|---|---|
| Number attaining this grade | 2978 | 2848 | 2860 | 1713 | 1071 | 321 | 11,791 |
| Percentage attaining this grade | 25.26 | 24.15 | 24.26 | 14.53 | 9.08 | 2.72 | 100 |
| Cumulative percentage | 25.26 | 49.41 | 73.67 | 88.19 | 97.28 | 100.00 |
Notes
- June 2020 grades were awarded without examinations taking place, due to the Covid‑19 lockdown
- The figures shown are the final results data at the end of August, as amended following the decision to award the higher of the centre assessed grade and the calculated grade.
- The total of 11, 791 in the table shows that there is a rounding error in at least one of the figures.
June 2019
Total entries: 9027
| GRADE | A | B | C | D | E | U | TOTAL |
|---|---|---|---|---|---|---|---|
| Number attaining this grade | 1503 | 1701 | 1824 | 1548 | 1111 | 1340 | 9027 |
| Percentage attaining this grade | 16.65 | 18.84 | 20.21 | 17.15 | 12.31 | 14.84 | 100 |
| Cumulative percentage | 16.65 | 35.49 | 55.70 | 72.85 | 85.16 | 100.00 |
June 2018
Total entries: 6849
| GRADE | A | B | C | D | E | U | TOTAL |
|---|---|---|---|---|---|---|---|
| Number attaining this grade | 1041 | 1255 | 1362 | 1222 | 885 | 1084 | 6849 |
| Percentage attaining this grade | 15.20 | 18.32 | 19.89 | 17.84 | 12.92 | 15.83 | 100 |
| Cumulative percentage | 15.20 | 33.52 | 53.41 | 71.25 | 84.17 | 100.00 |
June 2017
Total entries: 5376
| GRADE | A | B | C | D | E | U | TOTAL |
|---|---|---|---|---|---|---|---|
| Number attaining this grade | 656 | 890 | 1150 | 1008 | 789 | 883 | 5376 |
| Percentage attaining this grade | 12.20 | 16.56 | 21.39 | 18.75 | 14.68 | 16.42 | 100 |
| Cumulative percentage | 12.20 | 28.76 | 50.15 | 68.90 | 83.58 | 100.00 |
June 2016
Total entries: 2931
| GRADE | A | B | C | D | E | U | TOTAL |
|---|---|---|---|---|---|---|---|
| Number attaining this grade | 307 | 461 | 613 | 562 | 459 | 528 | 2930 |
| Percentage attaining this grade | 10.48 | 15.73 | 20.92 | 19.18 | 15.67 | 18.02 | 100 |
| Cumulative percentage | 10.48 | 26.21 | 47.13 | 66.31 | 81.98 | 100.00 |
Notes
- The total of 2930 in the table shows that there is a rounding error in at least one of the figures