Visualising inequality (by hand)
This competition is now closed
A Maths Week England 2021 competition for Primary pupils
We’re running a data visualisation competition from Monday 8 – Saturday 13 November 2021 during Maths Week England.
This competition is for Key Stage 2 pupils, but we’re running a similar competition for older students through the Advanced Mathematics Support Programme.
What’s involved?
The resources on this page provide opportunities for pupils to explore economic inequality data and to consider how hand-drawn data visualisations can be used to tell a story with data.
The visualisations pupils produce can then be entered into the competition.
The resources comprise:
- An online pre-task which your pupils can complete as homework (or in lessons if they have access to devices) before the first lesson. In the task, pupils will explore how wealth is distributed across the UK and the world, and the power of data visualisations. This short video shows you how to assign the task and view pupils’ responses. Please note that it is possible to do this activity on a phone but it will be more challenging due to the small screen.
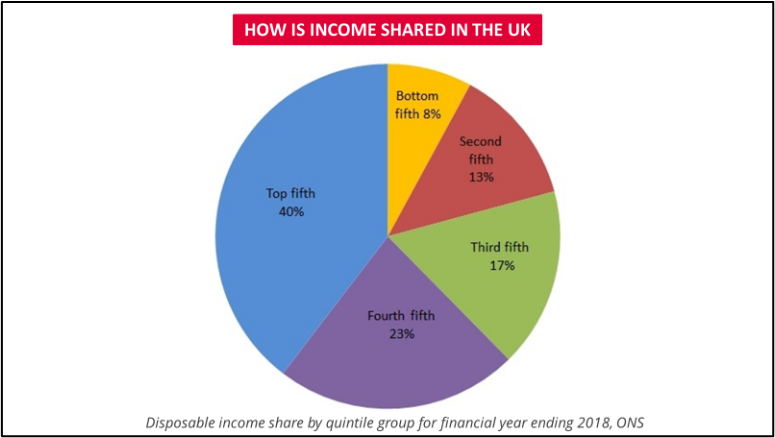
- This Visualising Inequality by Hand resource includes a presentation PowerPoint and accompanying worksheet for pupils to explore hand drawn data visualisations, get to know some income inequality data presented in a pie chart, get curious about it and have a data visualisation ‘idea party’.
- A short video in which Visual Storyteller, Catherine Madden, explains how she would begin to re-visualise the pie chart.

The resources were produced in collaboration with The Equality Trust which works to improve the quality of life in the UK by reducing economic and social inequality.
How to enter
Using the PowerPoint and video above to help them, pupils should ‘make over’ the pie chart into a hand-drawn data visualisation.
Teachers should email a photograph of each pupil’s visualisation with an accompanying short paragraph, audio or video description by the pupil that explains how they arrived at their idea and how they created it.
Make sure that you include the name of the school and the year group that the pupils are in.
Send your pupils’ entries to [email protected].
The deadline for submissions is Saturday 13 November 2021.
We also encourage you to share pupil entries on Twitter, tagging @MEIMaths and @equalitytrust and including the hashtags #VisualisingInequality #MathsWeekEngland.
Please ensure there is no identifiable pupil information shared without consent.
No final works should be created using chart software – all forms of analogue media are acceptable, and digital drawings and collages are also allowed.
Entries will be judged on the following criteria:
- Creativity
- Clarity – Consider who will see your entry. Are the diagrams and language clear?
- Impact – How do people feel on seeing your entry? What would you like them to do with the information?
Examples of visualisations will be showcased this website, and the school submitting the winning entry will receive a fantastic Turing Tumble marble-powered computer kit, kindly donated by Turing Tumble.
